The Coffee Nest
The Coffee Nest is a data science analytics dashboard built with ReactJS and Chart.js, designed to provide insightful visualizations and trends for coffee shop sales performance. It helps track product performance, predict future sales, and understand customer preferences through clear, interactive charts.
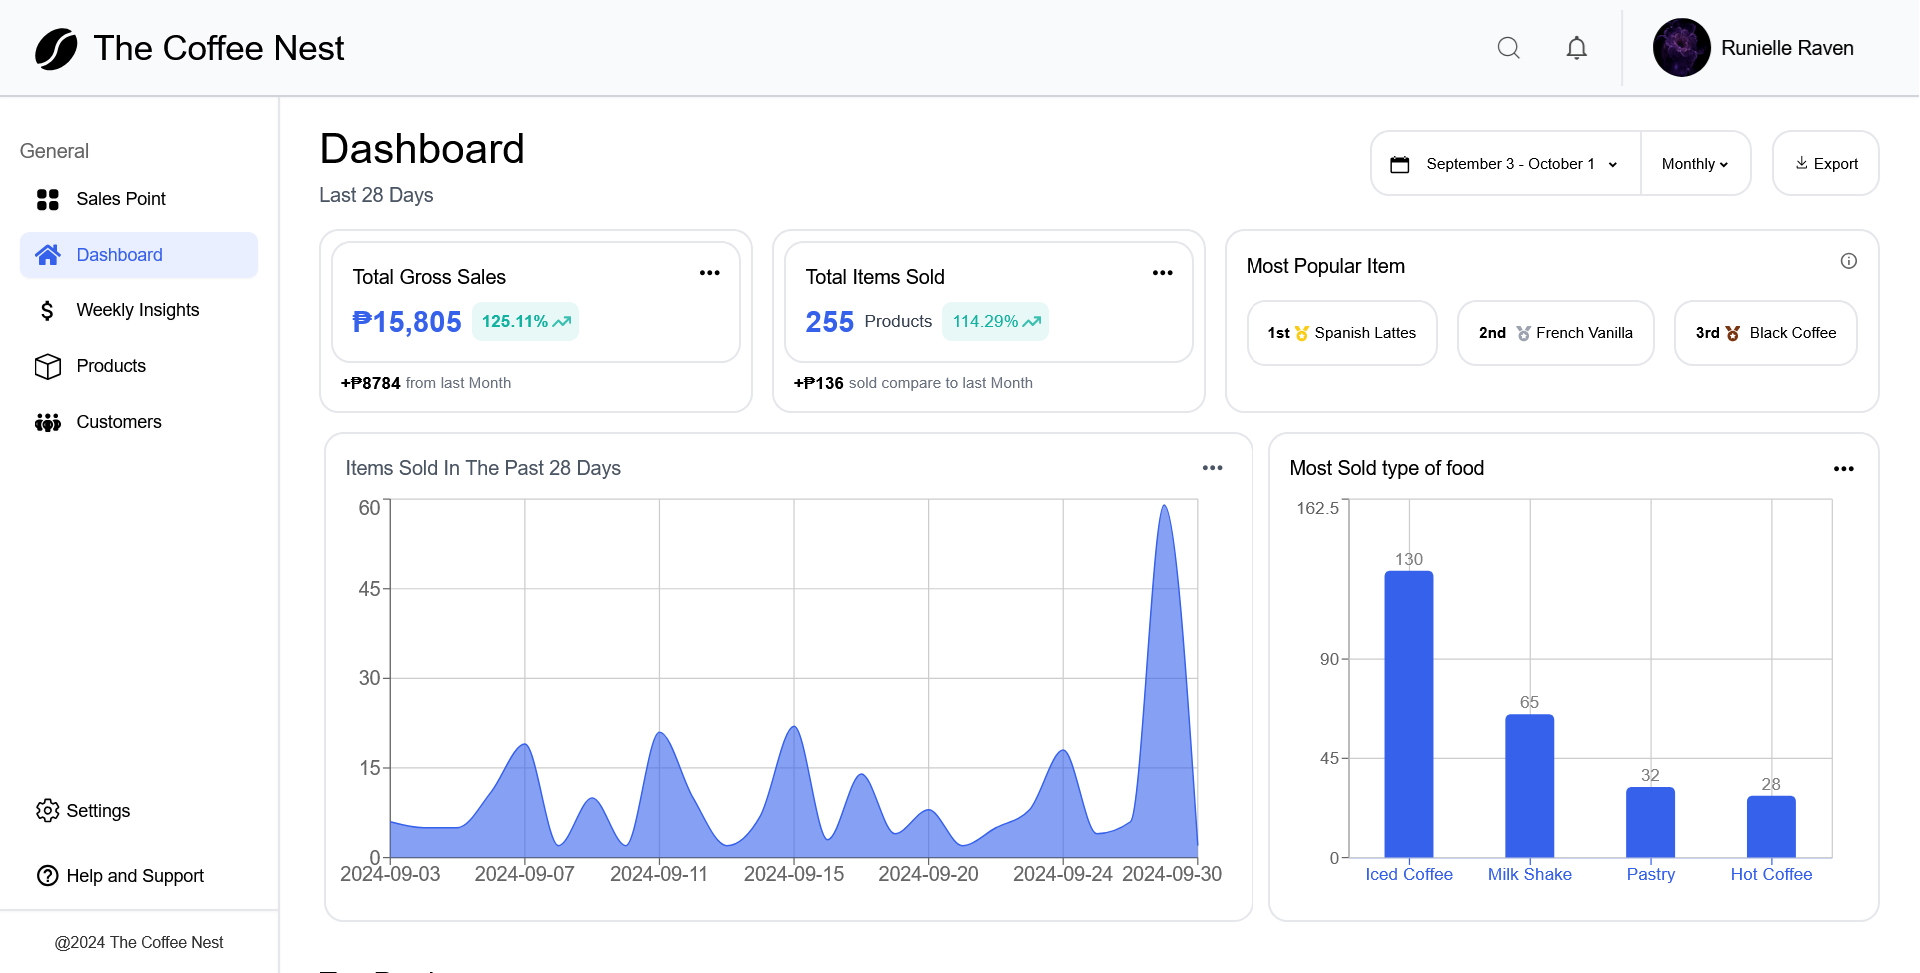
📈 Monthly Sales Overview
- Displays a line graph showing how many products were sold throughout the month.
- Enables managers and analysts to quickly identify sales trends and peak performance days.
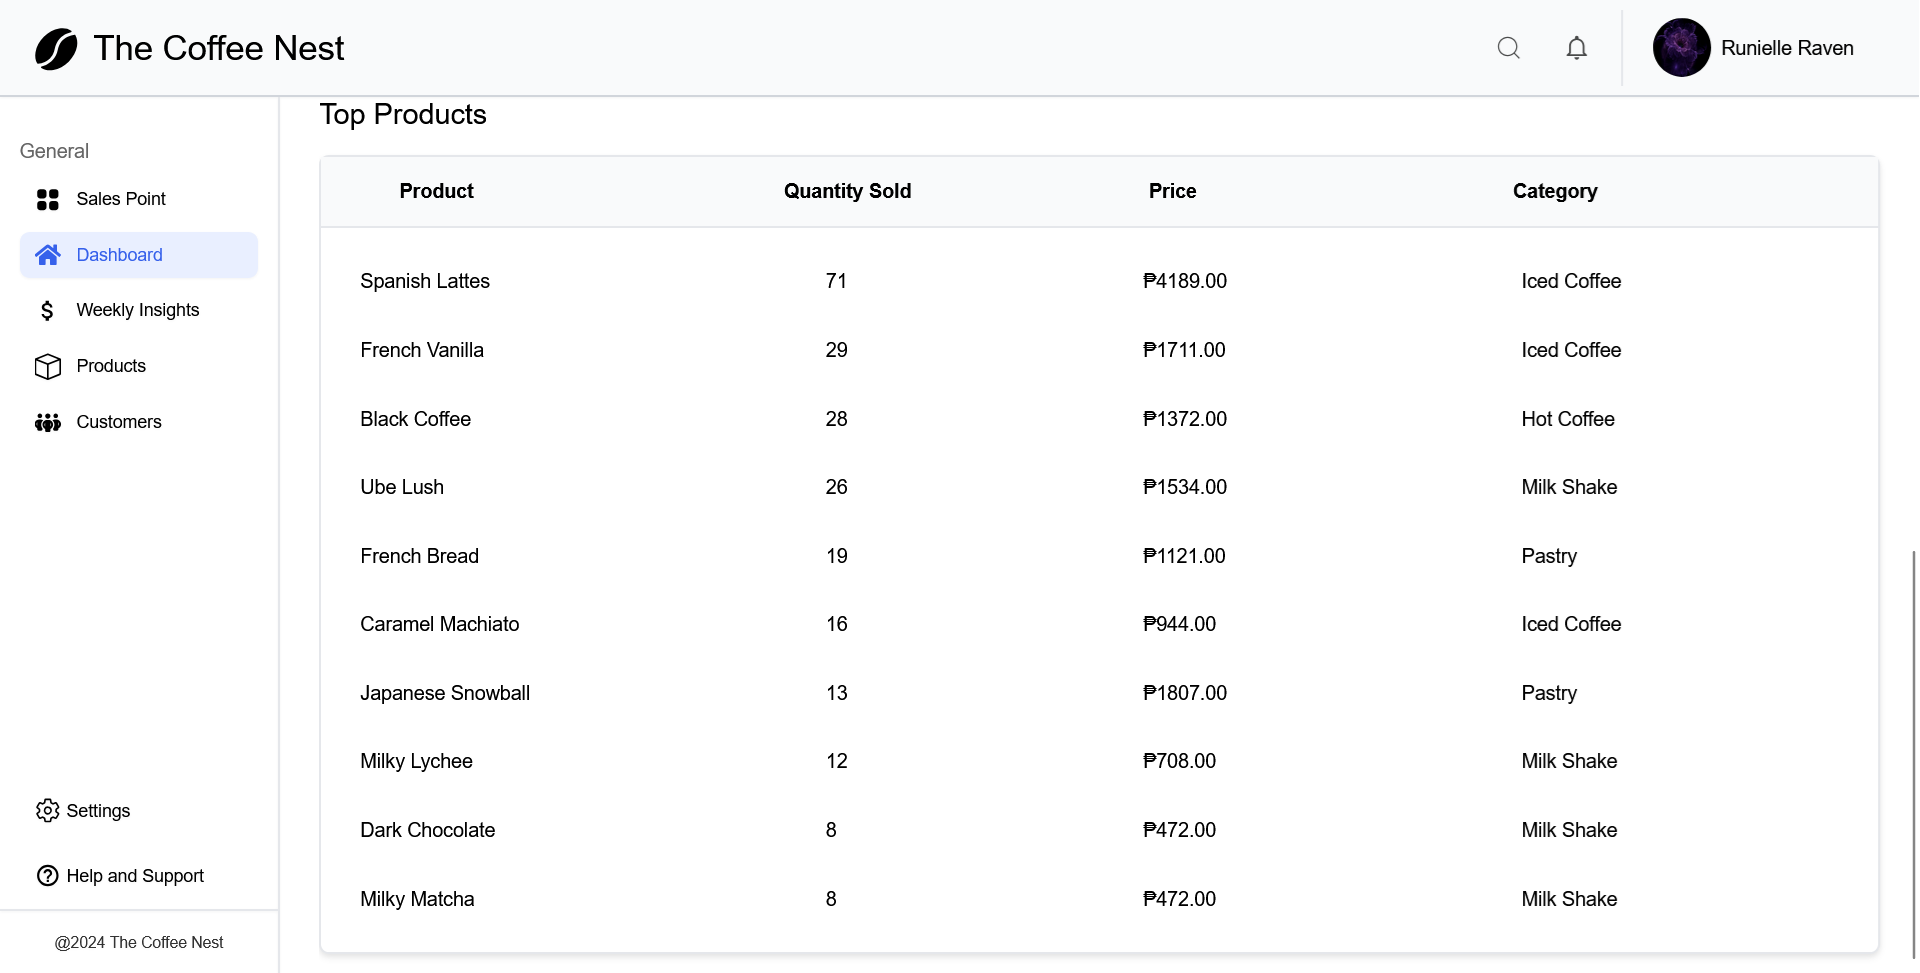
🏆 Top Performing Products
- Highlights the most sold product types.
- Lists the top-selling individual products for quick strategic insight into customer favorites.
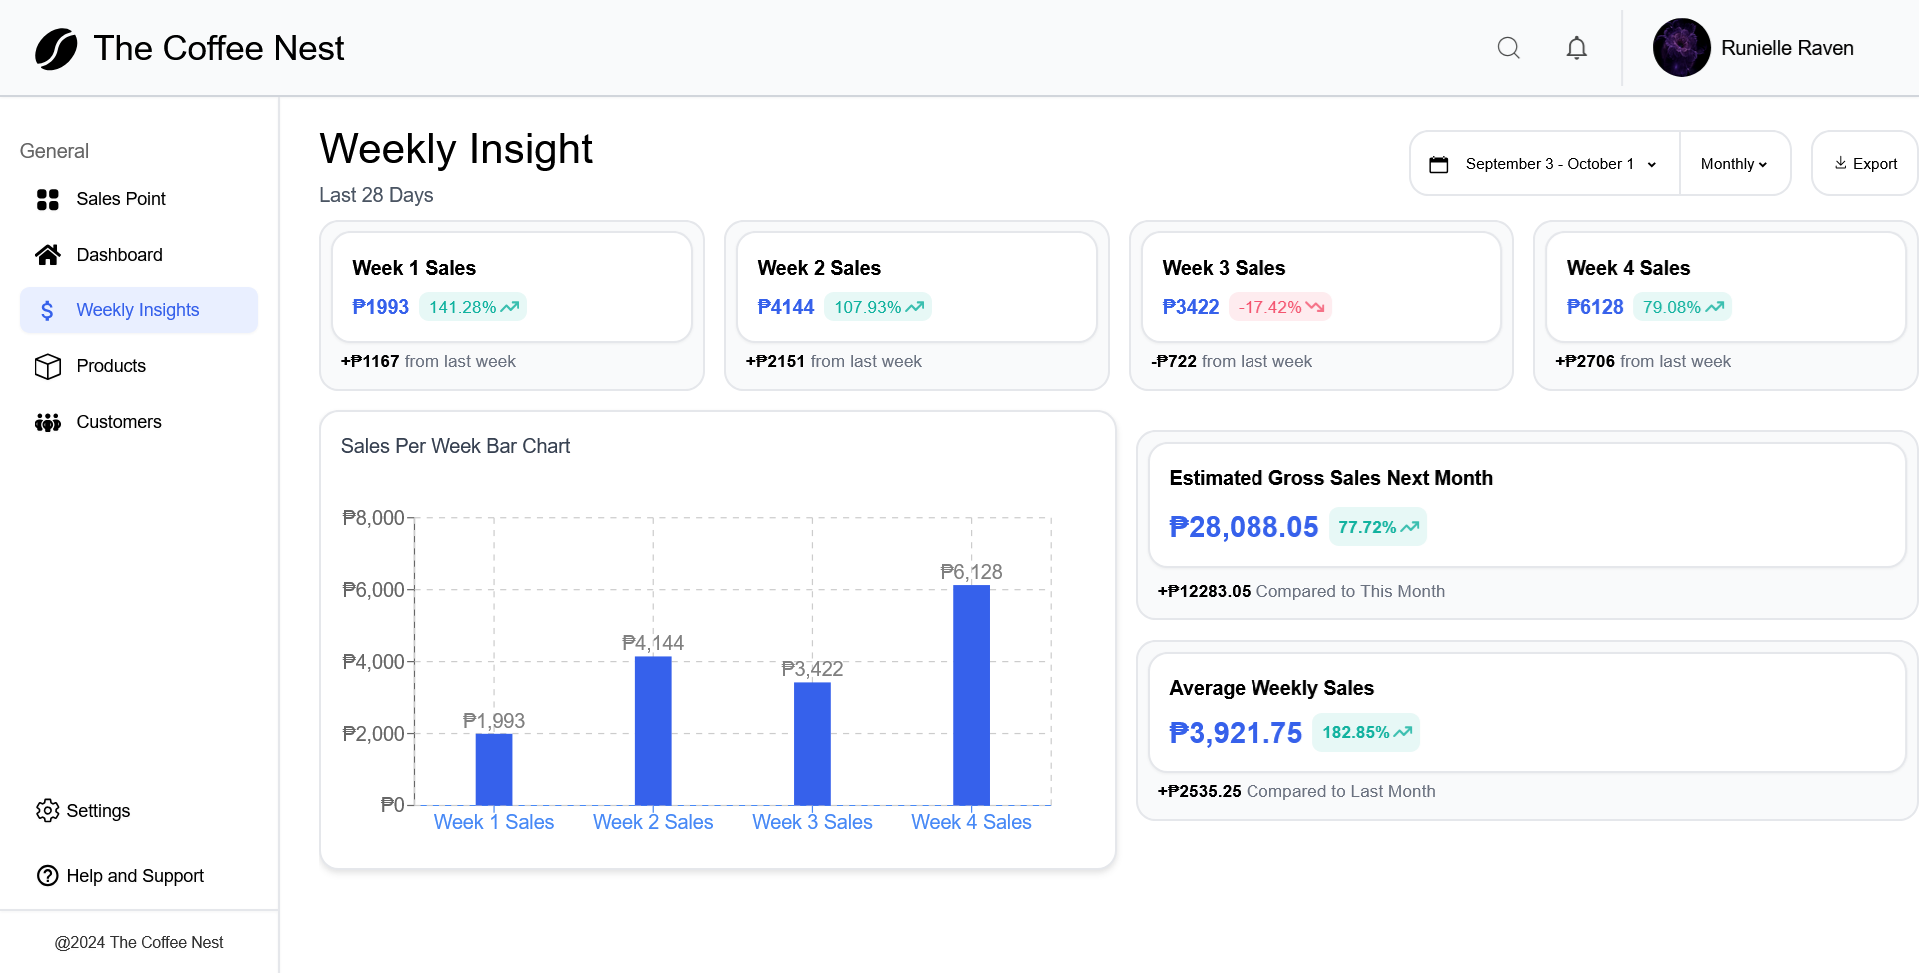
📊 Weekly Insights
- Breaks down sold items per week, giving a more granular view of sales performance.
- Helps identify performance gaps or spikes on a week-by-week basis.
📉 Sales Prediction (Forecasting)
- Predicts estimated gross sales for the next month using the Straight Line Method.
- Displays the average weekly sales to provide a clear overview of consistent performance and trends.
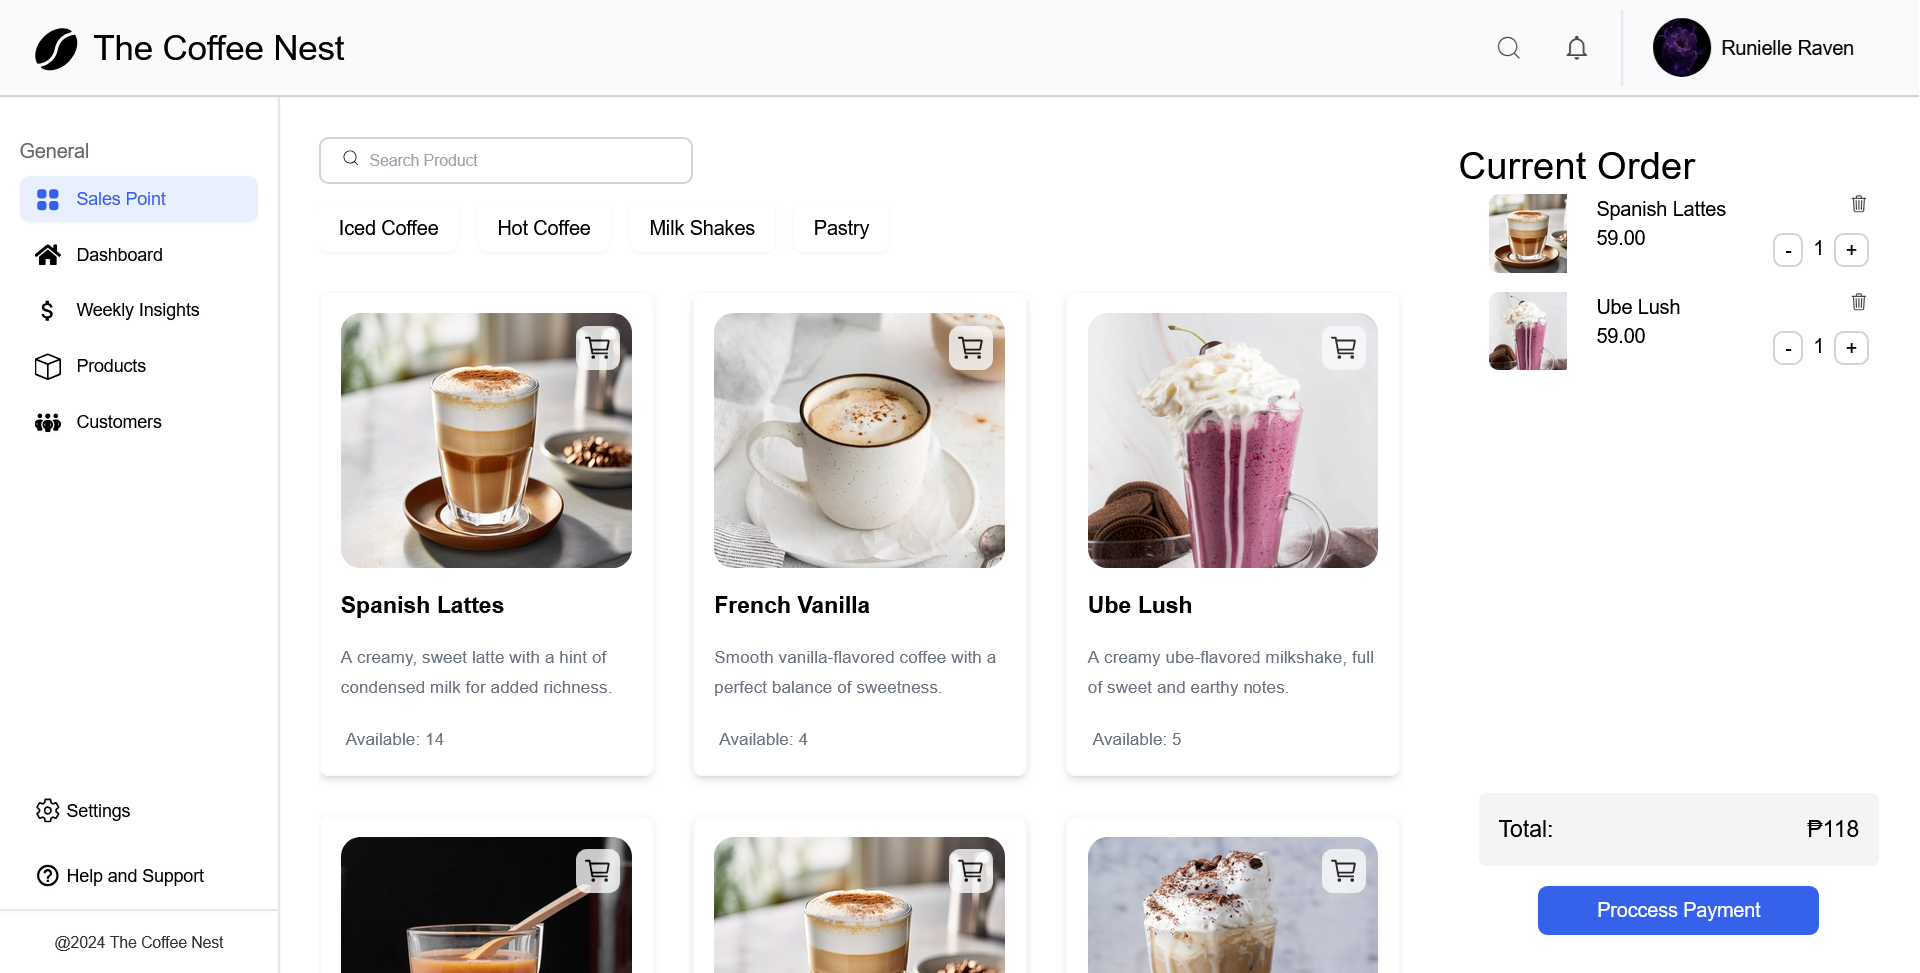
Also Added A POS System just to add data with ease for experiments
- ReactJS – Frontend library for building UI components
- Chart.js – For rendering responsive, interactive data visualizations
- (Laravel) - Backend Framework for Handling Data Management